
2025 was a near repeat of 2024. However, I anticipated a broadening of the US economy in 2025, yet quite the opposite prevailed; continued dominance by the Mag 10 stocks (Nvidia, Apple, Alphabet, Microsoft, Amazon, Meta, Broadcom, Tesla, Berkshire Hathaway, and Eli Lilly) exacerbated by April’s “Liberation Day” debacle.
So, despite demonstrable profitability, nearly 40% of the remaining 490 companies listed on the S&P 500 plumbed back to 52-week lows, giving rise to the term “Special K” (not the cereal) to describe the performance bifurcation between the “AI-have” and “Have-not” companies (Figure #1). As a result, equal-weighted portfolios like the Oasis Growth Fund (OGF), lagged the market (S&P 500 CAD = 11.92%). OGF performance: https://www.fieldhousecap.com/funds/oasis-growth-fund/.
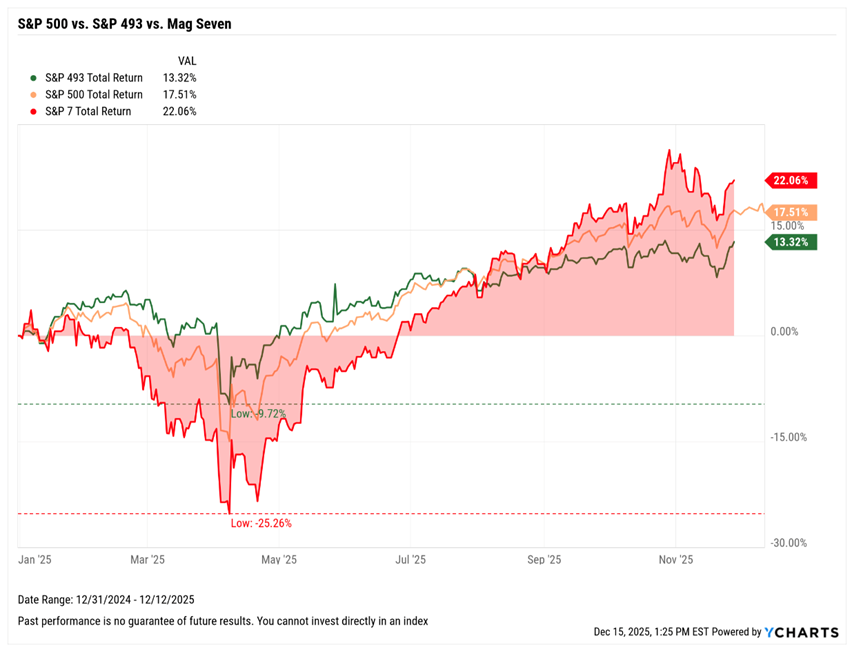
Figure #1 Source: YCharts
“It is worth noting that as of late summer (2025), quality investing has been out of favour and performance for 2025 has been flat after very strong 2024 and 2023 results. Interestingly, high quality stock relative underperformance [compared to negative cashflow businesses] is at 1999 extremes.”
Jason Del Vicario
Portfolio Manager, Hillside Wealth Management
The outlook for 2026, though, still looks promising. The backdrop and outlook is broken down as follows:
- 30-Second Economic Report Card
- 4 Investible Trends for 2026 & Beyond
- 6 Catalysts
- 6 Notable Risks
- 3 Oasis Growth Fund Pivots
30-Second Economic Report Card (as at Dec 22, 2025)
| Economic Criteria | Data | Comment | Grade (A-F) | Source |
| US GDP (Estimate) | 1.6 – 2.0% | LT Avg of 2.5% | C | BEA |
| 10 Year US Treasury Yield | 4.00% | Buffer under 5%. | A | Treasury |
| 10/2 Year US Spread | 0.68% | Positive sloping. | A | YCharts |
| Inflation (PCE) | 2.8% | Target range is 2-3%. | A | BEA |
| Unemployment Rate | 4.6 % | Full employment = 5% | A- | BLS |
| Service Industry (ISM) | 52.6 | Growing (84% of labor force) | A | ISM |
| Manufacturing (PMI) | 48.2 | Shrinking (8% of labor force) | D | PMI |
| Summary Grade = A | ||||
| Asset | 2025 YTD Returns | Comments | Grade (A–F) | Source |
| S&P 500 Index | 17% | 10-Year Avg = 13% | A | S&P 500 |
| Gold | 63.3% | China buying gold to backstop Yuan | A | Gold Price |
| Bitcoin | -6.2% | Functional value? | F | Yahoo |
| Oil (Brent) | -20.0% | 5-Year Avg = $74. Lower $$ is better. | A | MacroTrends |
| Summary Grade = A | ||||
4 Investible Trends for 2026 & Beyond
The following trends are expected to persist through the next several years. Along with each trend are a list of the stocks held by the Oasis Growth Fund poised to benefit from these trends.
1. Artificial Intelligence (AI)
-
This is still the very early stage of AI adoption by businesses, governments and consumers. The trend is expected to endure across multi-decades, driving investment across all industries (Figure #2) on a global basis. Hyper-scaling companies (Amazon, Meta, Google, Microsoft and Oracle) have already lifted their 2025/26 capex from $280B to $405B. Beyond the obvious AI headline businesses (Open AI, Claude AI, etc), there is a robust eco-system surrounding this 4th Industrial Revolution. The OGF is taking a diversified ‘picks & shovel’ approach to capture AI growth.
-
Hardware Devices & Semi-Conductors
- OGF – Nvidia, Taiwan Semi-Conductor, Micron Technologies, Arista Networks
-
Data Management & Cloud Infrastructure
- OGF – Amazon, Google, Microsoft
-
Foundational Models & Core Capabilities
- OGF – Meta
-
AI Applications & Software
- OGF – Service Now
-
Hardware Devices & Semi-Conductors
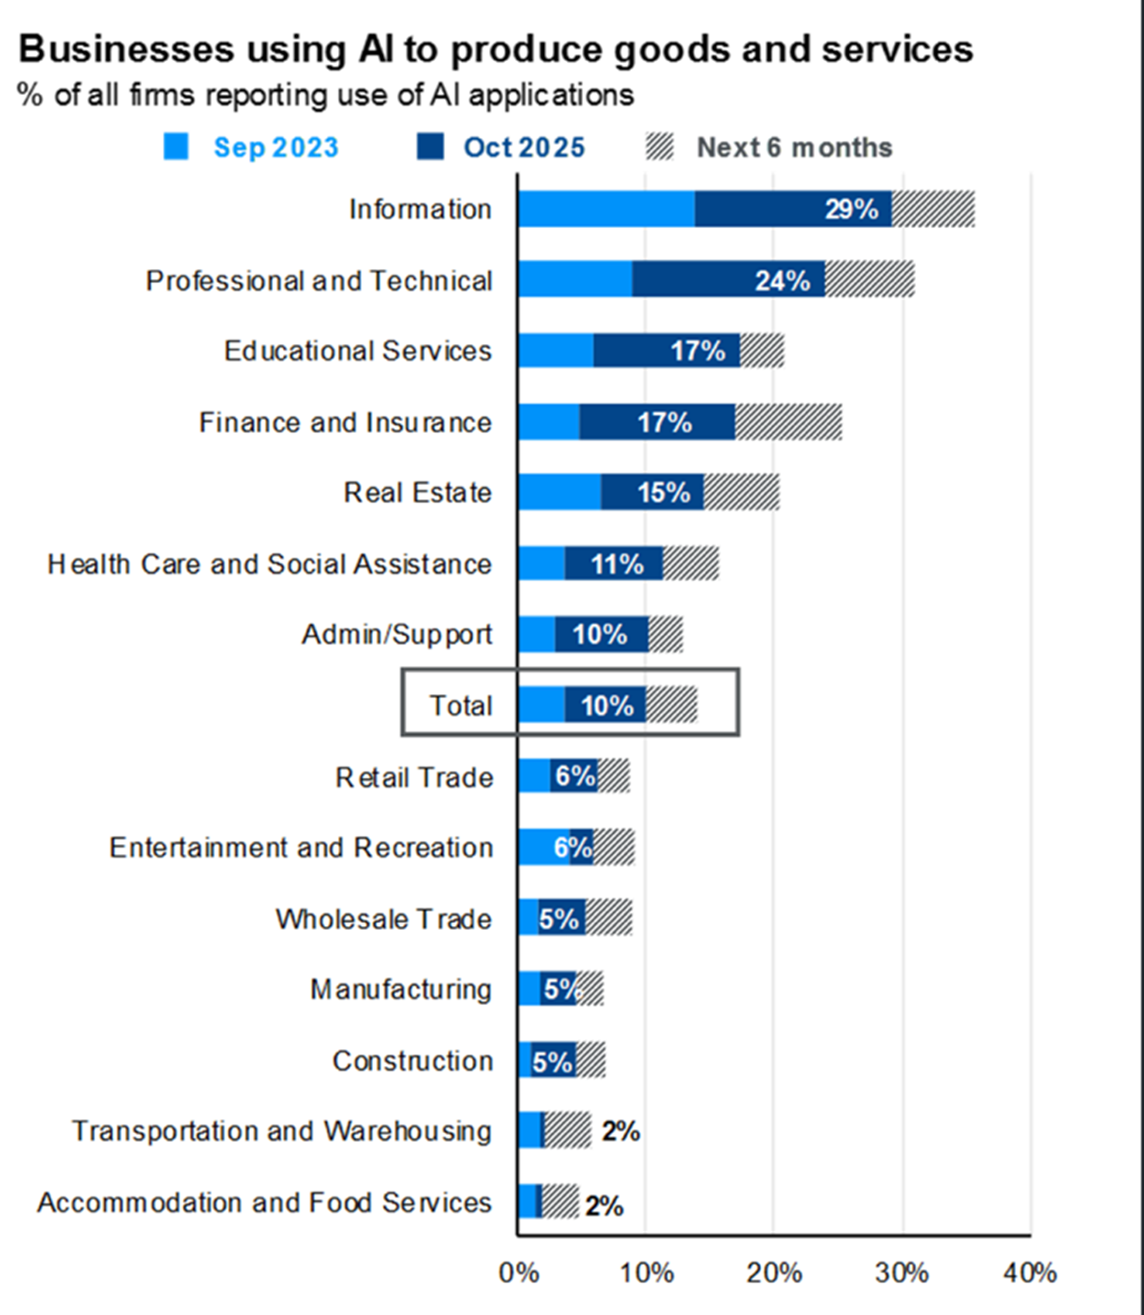
Figure #2 Source: JPMorgan Guide to the Markets
2. Global Security
-
Increasing geopolitical tensions and cyberattacks on critical infrastructure are demanding ever-increasingly sophisticated security solutions.
- OGF – Palo Alto Networks
-
Defense, aerospace, and space-adjacent industries are accelerating amid heightened geopolitical tensions and technological competition.
- OGF – TransDigm
3. Rebuilding America
-
A national build-out of the energy infrastructure to support EV and data centres will be key for the next several years fuelling a commodity up-cycle for rare-earth minerals and basic metals such as copper (Figure #3). US Congress is expected to table another “Big Beautiful Bill” (BBB 2.0) to modernize U.S. infrastructure—bridges, roads, rail, ports, and airports.
- OGF = Sterling Industries, Quanta Services, AtkinsRéalis Group
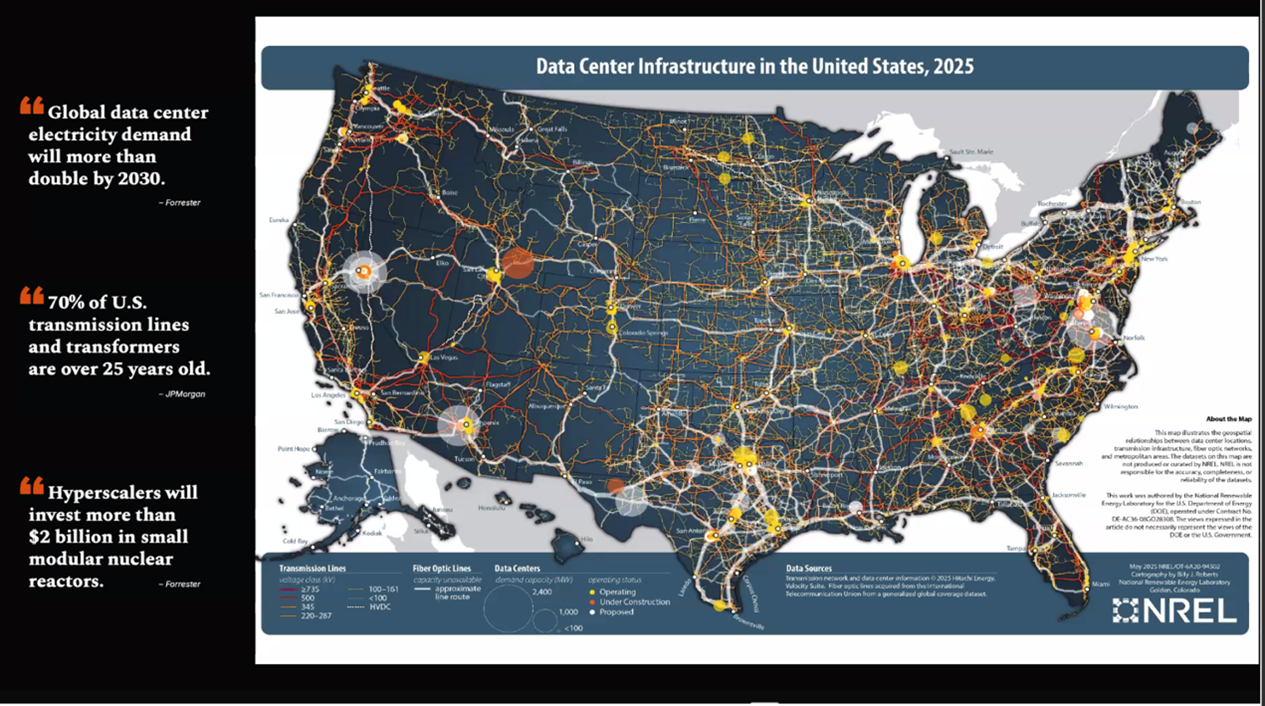
Figure #3 Source: Visual Capitalist
4. Energy Security
-
Energy security and transition to a low-carbon economy requires substantial investment in power generation, grid stability, energy sources, including renewable and nuclear. Rising energy demands from the EV sector and data warehouses are currently stressing the available supply. The US invasion of Venezuela will provide exclusive access for US companies to the world’s largest oil reserves.
- OGF = TerraVest Industries, Quanta Services, GE Vernov
6 Catalysts
1. Corporate America continues to deliver. During Q3 ’25 corporate earnings season, 83% of S&P 500 companies beat earnings expectations (according to FactSet), marking the ninth consecutive quarter of positive earnings growth. For 2026, corporate profitability is expected to increase substantially to 14.5%, according to FactSet.
2. Consumer Confidence (CC) may currently be weak but historically is a contrarian indicator. Figure #4 suggests that when consumer confidence reaches a low ebb, it is consistently followed by double-digit stock market rallies. The latest CC print is at a 50-year low.
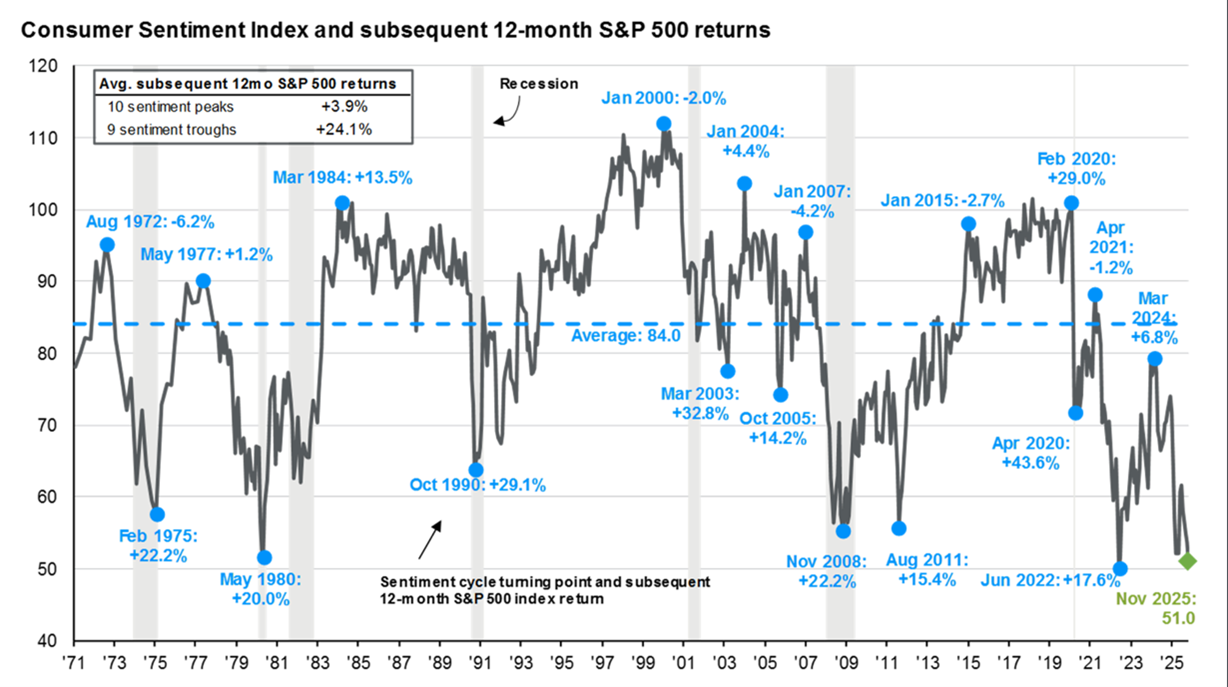
- Figure #4 Source: JPMorgan Guide to the Markets
3. Technical Indicator – the very rare Zweig Breadth Thrust Indicator activated in April ‘25 projects that this rally should last well into 2026.
4. Dovish monetary policy. When Jerome Powell’s term as Federal Reserve Chairman comes to an end mid-May 2026, the probability is that a loyalist will be appointed with an explicit mandate to supply easier monetary policies (lowering the Bank Rate, Quantitative Easing, etc.). “This could be huuuge!”
5. Pro-business fiscal & tax policies will provide further tailwinds, including tax incentives, chip-manufacturing subsidies, continued deregulation, and infrastructure spending (BBB 2.0).
6. Payment of a ‘Warrior Dividend’ by the US Administration to active members of the military prior to Xmas should translate into a bonus for retailers.
- Central banks globally are reducing reliance on the $USD, shifting to gold, euros, and yuan. Sanctions policies have accelerated this trend
6 Catalysts
Despite the above-noted constructive fundamentals, there are ‘storm clouds’ on the horizon (listed in no particular order):
- US Administration policy unpredictability, including potential renewed tariff escalation and subversion of the upcoming USMCA renegotiations, is continuing to erode America’s ‘soft power’.
- A change in the Federal Reserve leadership from the last adult in the room to a loyalist, could reignite inflation and induce unhealthy currency dynamics for the $USD. J. Powell’s term ends May 2026.
- Unprecedented pace of debt issuance. The US national debt is $38T (Debt clock) and rising at $1T per month. At 19% of the US Federal budget, interest is the second largest expenditure (Social Security =22%, National Defense =14%). This is sustainable only if GDP remains above 3%.
- Unwinding the Japan ‘Carry Trade’ – Japan’s decision to raise interest rates above zero (since 2016) could result in the Japanese Gov’t selling-off a significant portion of the world’s largest foreign reserve of U.S. Treasuries (Japan holds ~$1.2T). By selling $US Treasuries and repatriating the capital back to Japan, the value of the Yen will likely rise. This would be a double whammy for highly leveraged hedge funds who could be forced to sell risky assets (often illiquid) to repay their Japanese loans. Thus, raising Japanese rates even slightly could induce volatility across global bond and FX markets.
- Geo-political ‘Black Swan’ risks, including the potential for global systemic stress stemming from a collapse in the Russian economy and/or escalation in any of the other current conflict hot zones (Venezuela, Ukraine, Gaza, SE Asia (Taiwan), sub-Saharan Africa, Greenland).
- Overall, extended market valuation remains the primary concern. The Warren Buffett Indicator (Figure #5) places the S&P 500 at approximately 230% of U.S. GDP. This is just math. If 2026 earnings accelerate, which is expected, there could be a soft landing. However, at a P/E of 27x, the market is in nose-bleed territory (historical avg P/E is ~18x).
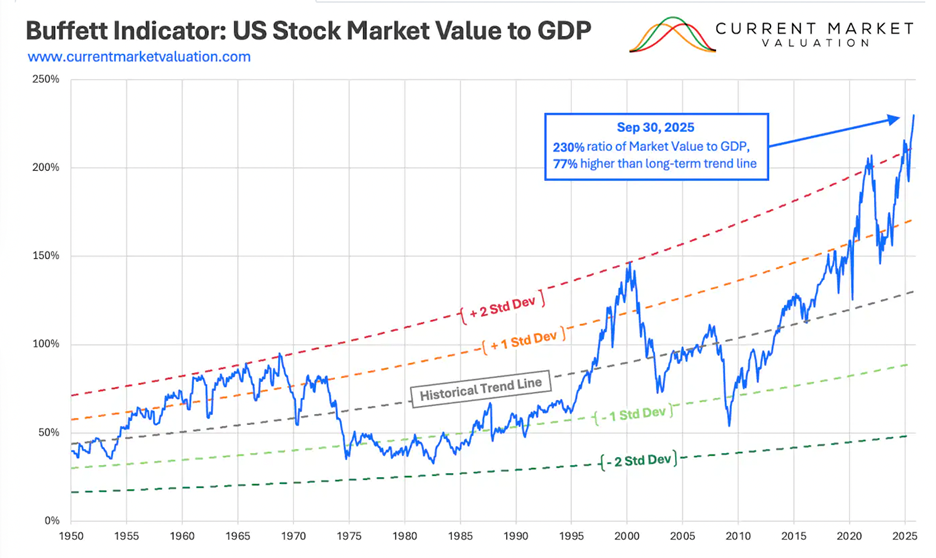
Figure #5 Source: Current Market Valuation
Oasis Growth Fund Pivots
Underlying perspectives:
- Cautiously bullish.
- Economic factors are stable.
- US Administration is pro-business, to a fault.
- US economy will be “juiced-up” by favourable Monetary and Fiscal policies.
- Corporations are profitable and investing significantly in Capex (i.e., AI). Amongst all factors, Capex provides the greatest economic multiplier.
- Consumers are severely bearish, yet, historically, this is a bullish signal.
- To increase the potency of the OGF, the core portfolio has been reduced from 40 to 30 high quality compounding growth stocks, primarily focused on the 4 themes mentioned above, but still sector diversified.
- Increased hedging protection due to the persistent elevated market valuation.
- An FX short on the $USD given concerns about wonky US policies, excessive, persistent budget deficits, and the growing risk of a reversal of the Japan ‘Carry Trade’.
In the pursuit of long-term growth, the OGF invests in top quality, North American compounding stocks (growth +dividends + loan repayments + share buybacks + corporate spin-offs). Being an equal weighted portfolio, the reduction of positions will naturally increase the average position size (from 2.5% to 3.3+%). This is in anticipation that the Mega 10 will continue to hold value but that there should also be a worthy broadening of the economy and subsequent recovery in the ‘Special K’ stocks. Historically, markets advance better when faced with a “wall of worry”.
For an update on the Oasis Growth Fund core stock positions, contact the PM:
Fieldhouse Pro-Funds
Disclosures
This investment memorandum expresses the views of the author as of the date indicated and such views are subject to change without notice. Fieldhouse Capital Management Inc. (herein “Fieldhouse”) has no duty or obligation to update the information contained herein. Further, Fieldhouse makes no representation, and it should not be assumed, that past investment performance is an indication of future results.
The return of the Oasis Growth Fund is based on monthly total returns of the Fieldhouse Pro Funds Trust – Series O Oasis Growth Fund in Canadian dollars since inception at January 1st, 2020. All returns are time-weighted total returns of the F class, net of fees, and annualized for periods one year or greater.
Fieldhouse Capital Management Inc. is the Investment Fund Manager, Portfolio Manager and trustee of Fieldhouse Pro Funds Trust Advisor Series funds. Fieldhouse Pro Funds Trust funds are subject to management fees, trailing commissions, incentive fees and administration fees. For detailed information on fees see the the Fieldhouse Pro Funds Trust offering memorandum and the Series O offering memorandum supplement or the term sheets.
The Series O Oasis Growth Fund of Fieldhouse Pro Funds Trust was previously Class O of Fieldhouse Pro Funds Inc. The fund changed it’s investment strategy and it’s name from the “Oasis Canadian Growth++ Income Fund” to “Oasis Growth Fund” on January 1st, 2020. The fund NAV was reset to $10 at that time. The funds strategy changed from a Canadian growth and balanced fund to the North American Growth fund described on this page and in the Fieldhouse Pro Funds Trust offering memorandum. Class O of Fieldhouse Pro Funds Trust was previously Class B of Fieldhouse Pro Funds Inc. which had an inception date of April 1 2016. Fieldhouse Pro Funds Inc. converted to Fieldhouse Pro Funds Trust on January 1st, 2022. Historical fund performance for previous strategies is available on request. The Fieldhouse Pro Funds Trust offering memorandum and the Series O offering memorandum supplement contain additional information that should be considered by all investors prior to investing.
This memorandum is being made available for educational purposes only and should not be used for any other purpose. The information contained herein does not constitute and should not be construed as an offering of advisory services or an offer to sell or solicitation to buy any securities or related financial instruments in any jurisdiction. There are many important factors to consider when investing and you should seek professional advice that can assess your personal circumstances and risk appetite. Certain information contained herein concerning economic trends and performance is based on or derived from information provided by independent third-party sources. Fieldhouse believes that the sources from which such information has been obtained are reliable; however, it cannot guarantee the accuracy of such information and has not independently verified the accuracy or completeness of such information or the assumptions on which such information is based.
This memorandum, including the information contained herein, may not be copied, reproduced, republished, or posted in whole or in part, in any form without the prior written consent of Fieldhouse.